01 May 2020, Iris Proff
© Arco Mul
While scientists are working hard to fight the COVID-19 pandemic, the pandemic is also changing science. Often, researchers are not particularly visible in public debates. In the last few months, however, many scientists and research institutes are experiencing an unprecedented level of attention. Suddenly, many more individuals and journalists are eager to learn about scientific progress and fiercely discuss COVID-19 related publications on social media. Scientists find themselves increasingly called into their social role as communicators of research to governments and the public.
We need scientific insight to answer the questions we are facing in the Corona crisis: Which social distancing measures are effective? Does using masks and gloves decrease infection risk? Which measures should be taken to prevent economic breakdown? How can we protect the mental health of citizens during a lockdown? With this pressing need for answers, the pace of scientific discovery is speeding up. Research grants are given out quickly, scientists finish manuscripts at high-speed, and peer-reviews are completed much faster than usual. Since the beginning of the year, thousands of scientific papers about COVID-19 have been made available, and the number is increasing daily. This massive amount of information is becoming increasingly hard to handle.
Mapping what we know about the virus
Giovanni Colavizza, a scientist at the University of Amsterdam in the field of Digital Humanities, set out to help tackling this information flood. He used tools from artificial intelligence and data science to organize the extensive literature related to COVID-19 into a map. His project is an instance of what is referred to as science studies – researching the process of research itself. “It’s as meta as you can get”, he says laughing.
The first results of this project, a close collaboration with the Centre for Science and Technology Studies at Leiden University, have been made available last week on the preprint server bioRxiv. Colavizza and his colleagues worked on the CORD-19 dataset, which was provided by a cooperation of US research institutions and contains roughly 50, 000 scientific publications supposedly related to COVID-19. The dataset is meant to encourage researchers to apply machine learning to gain insights about the pandemic.
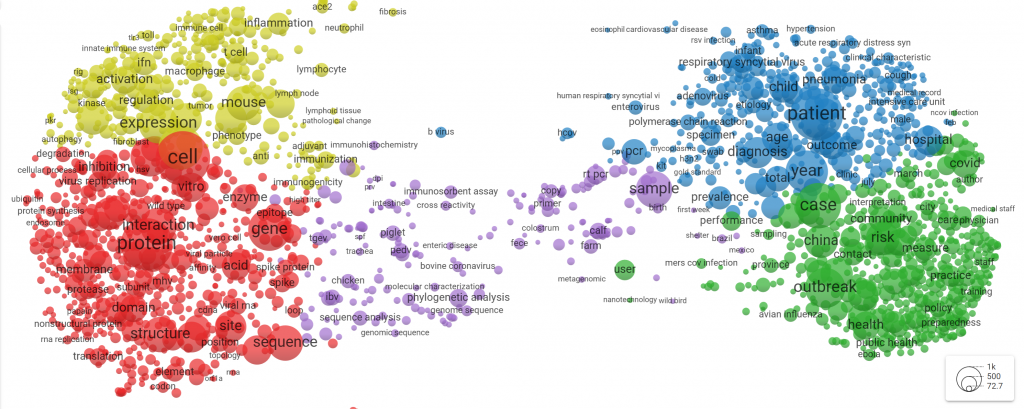
Using artificial intelligence algorithms for Natural Language Processing (NLP), Colavizza and his colleagues scanned the abstracts and titles of each paper from the dataset and extracted keywords, such as ‘outbreak’, ‘patient’ or ‘immune cell’. The researchers then computed how likely each pair of keywords is to be mentioned together in one paper. From this information, they constructed a term map, illustrating which topics the dataset covers and how they are related. The closer two keywords appear in the map, the more likely they are to occur together. For instance, ‘China’ and ‘outbreak’ appear close together – suggesting that these concepts are intimately connected. Meanwhile, ‘China’ and ‘protein’ appear far apart – suggesting no specific connection between those terms.
A cluster analysis of these keywords revealed that the dataset covers 5 clusters of topics. “Interestingly, only a subset of the articles is directly concerned with the COVID-19 virus” Colavizza notes. “Most of them contain relevant contextual information.” This can easily be seen from the map below: The biggest cluster (red) evolves around molecular biology of viruses in general. The second biggest cluster (green) deals with the past and present outbreaks of viruses from the corona family (SARS, MERS and COVID-19). The third cluster (blue) talks about public health and the fourth about the biology of the immune system (yellow). For an interactive version of the map, click here.
The map looks neat – but what can we do with it? Colavizza is not short of ideas: using measures of how central an article is in the network, he can extract the most popular or reliable sources of information from a cluster. By comparing the map with a map of all published articles from the Web of Science, he can pinpoint papers relevant to the pandemic but missing in the CORD-19 dataset.
Colavizza has another, very concrete idea: “Wikipedia is a massive broker of information about the pandemic” he says. The platform now uses restricted editorial policies for updating information about COVID-19 to guarantee reliable information. By comparing Wikipedia’s references to his map, the researcher wants to check if the platform is covering all relevant clusters of information. But that’s not all: By automatically monitoring upcoming publications and locating them in the map, he wants to develop a tool to recommend central articles to Wikipedia’s editors.
How scientists communicate with the world
Scientific articles are the means by which scientists communicate with each other. But Colavizza also wants to understand how scientists communicate with the rest of the world, and if this is changing over the course of the crisis. “The pandemic has become a social problem. That means a lot of people have something to say about it – not only epidemiologists”, he states. And they do so, most often, via social media.
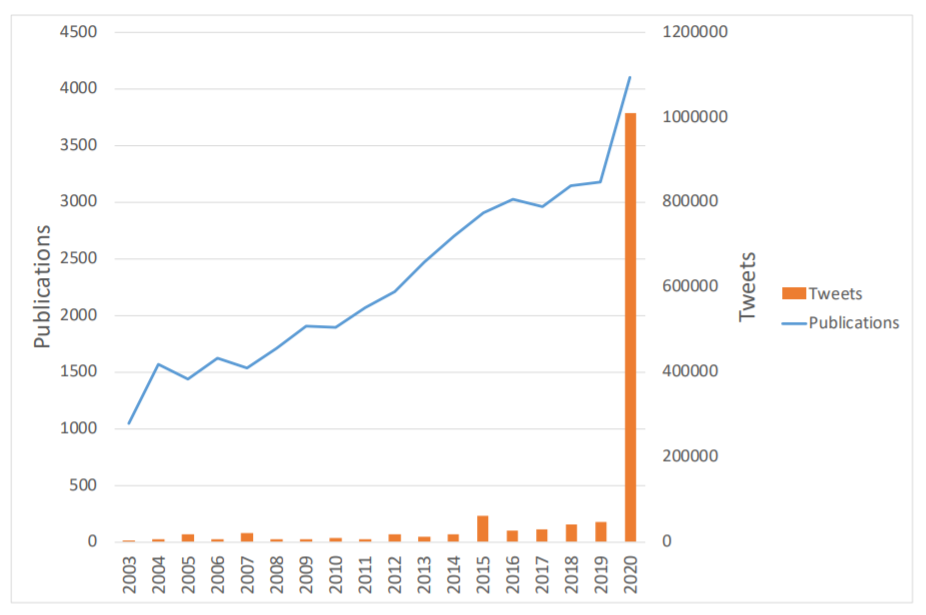
Therefore, Colavizza and his colleagues took a closer look on their COVID-19 map and combined it with Twitter data. This data indicates which papers from the dataset have been mentioned in Tweets.
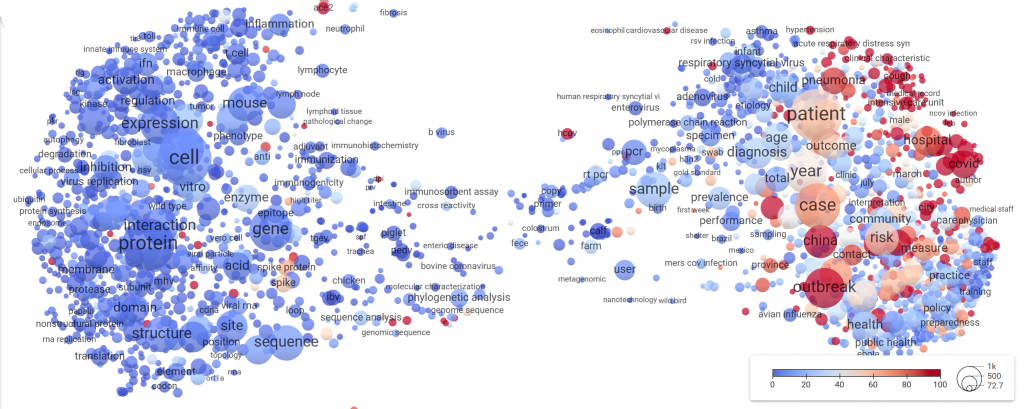
Their observation: The majority of Tweets mention papers directly related to the Corona outbreaks and Twitter mentions are skyrocketing for papers published in 2020. Long-standing scientific knowledge seems to be largely disregarded by social media in the light of the steady stream of new science about COVID-19. This focus on present-day research may bear the risk that scientific advice is misunderstood, the researchers warn.
Not all information spread through the web as ‘scientific facts’ fulfills scientific standards. Despite being sped up in these times, the peer review process – the backbone of the scientific endeavor – takes its time. Now, many scientists have started to publish their results as preprints, before these have been approved by fellow scientists. This can be problematic, as this example from a research group in New Delhi shows: On January 31st, the group published a preprint stating an “uncanny similarity” between the HIV and COVID-19 viruses, which – so they say – is unlikely to happen naturally. The work was subsequently harshly criticized by the scientific community. Nonetheless, it quickly spread through social media and fueled conspiracy theories about human engineering of the virus.
This shows that it is vital that scientists contribute to discussions on social media these days to counter misinformation. But how does this happen? Colavizza wants to find out. For this second project, he has just received a research grant, which the NWO has made available in record time. He is planning to have researchers from different fields fill in systematic surveys every month. These surveys will enquire how scientists seek and spread COVID-19 related information on social media. Do they fact-check statements by fellow researchers or journalists? Do they comment or share them? Do they pinpoint misleading statements or fake news? Do they share their own findings? And how will this change over the course of the pandemic?
“We see that during the crisis, many scientists have taken up the role to communicate their research to the public”, Colavizza says, “Even though many of their findings are very technical”. Traditionally, scientists are known to conduct their research behind closed lab doors and communicate it mainly in a language that is all but accessible to anyone outside of science. Now, during the pandemic, this might be changing – it seems that both the public and the scientific community are reinterpreting the role scientists play in our society. We need scientists, not only to generate insights, but also to make sure these are understood and put into practice.